Tuesday, August 3, 2010

Camping trip to Gulkana Glacier

Yay! I finally was able to go to glacier. I went with my friend Wendy for 3 days. We drove South from Fairbanks on the Richardson Hwy until we reached the road to the glacier (just past the Richardson Monument before Summit). We set up camp on a sandbar of Phelan Creek.

View of Gulkana Glacier from the Richardson Hwy

At around midnight a guy and his daughter pulled up and said they had seen a grizzley about 200 m up the creek. We packed up camp and the guy suggested that we all camp together further down the creek. We weren't opposed to the idea until we noticed that the guy's behavior was extremely erratic and wierd. He told us that he was in the military and did the northern training. Then he suggested that we all go on the glacier tomorrow and he wold lower us in to a crevasse and take us ice climbing and skiing. We were getting very odd vibes from him, so we decided to camp at Fielding Lake Camp Ground about 2 miles North on the Rich. Hwy.

Fielding Lake

The next morning we had breakfast at Tangle Lakes on the Denali Hwy in hopes that the weather would clear up and be more enjoyable for hiking.

Tangle Lakes on the Denali Hwy

The weather got better and so we headed back North to the glacier. We saw the crazy guy and his daughter leaving as we were making our way in.

Wendy and the old suspension bridge crossing Phelan Creek


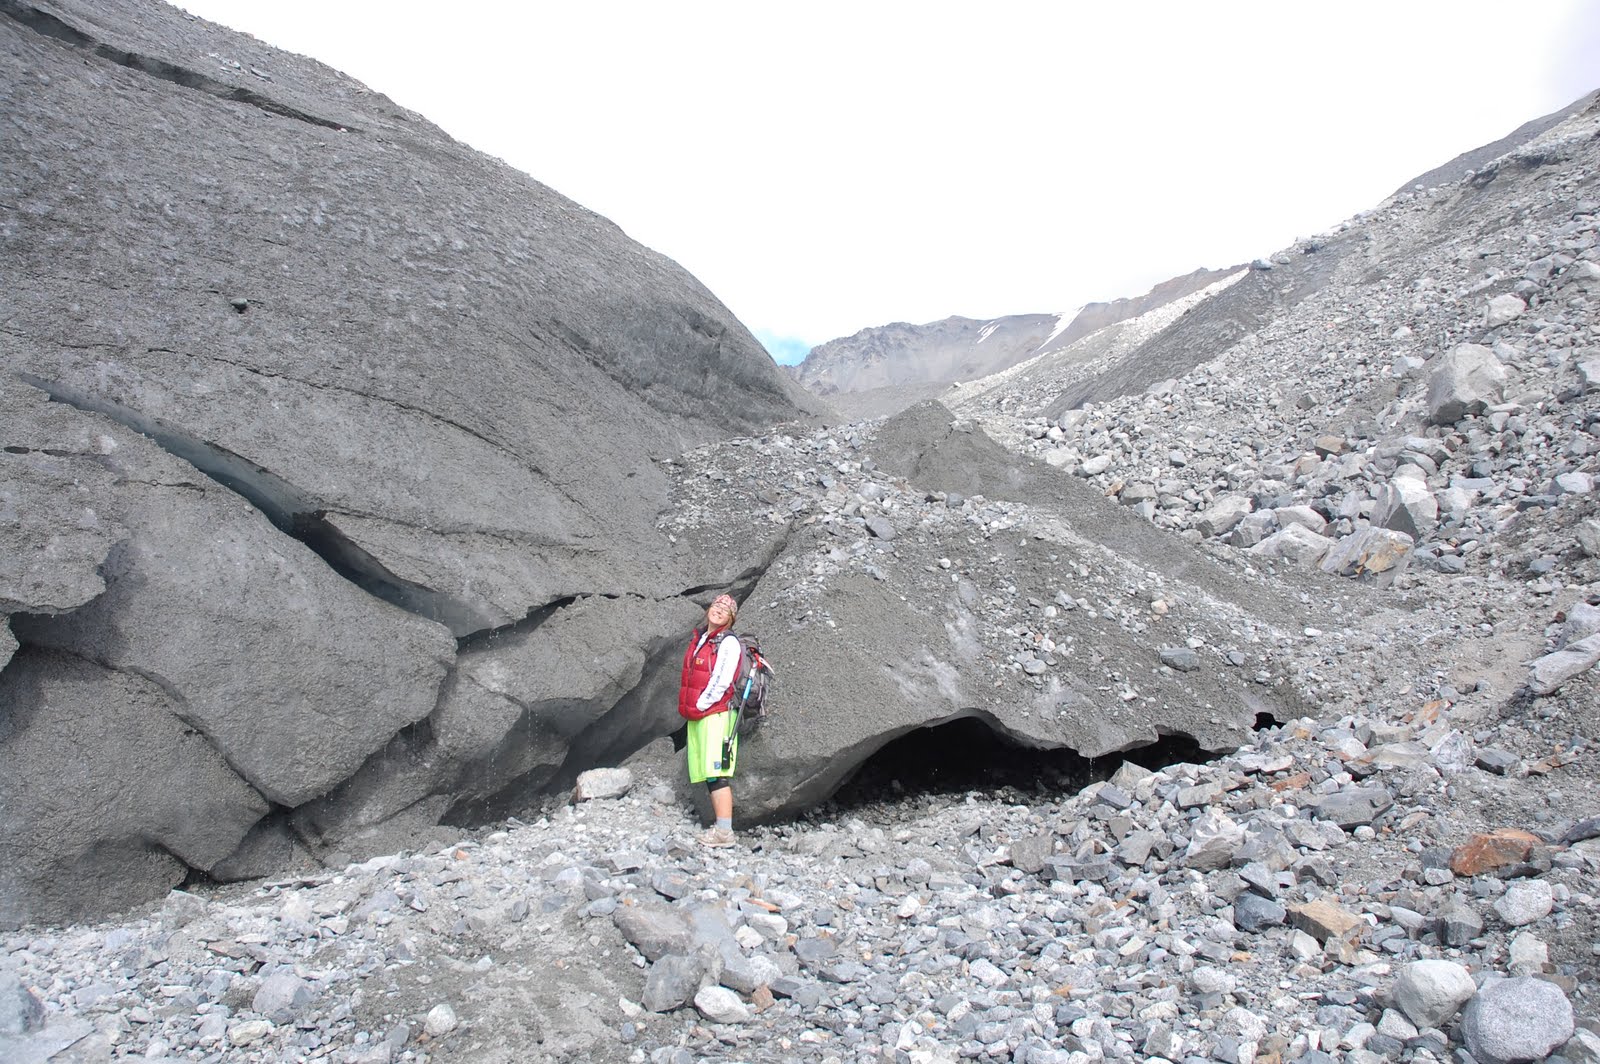
Me at the terminus of the glacier.


it's melting! AH!

The glacier was extraordinary. It made us feel very vulnerable and insignificant. There was lots of falling debri and creek was rushing with water. Hiking back out we passed about three groups of tourists. None of them had bear spray, or even backpacks. One girl was wearing flipflops. It was slightly rediculous.

We spent Sunday night at Coal Lakes about 20 miles from Delta Junction. In the morning we were awoken by heaving breathing and gravel moving. A large mammal was inspecting our tent and romping around. We are pretty sure it was a bear by the sound of the movement and breathing, though we couldn't find any tracks or animal signs. I have never been more scared in my life. We we thought it was gone we crawled out of the tent and made as much noise as possible and packed up camp. We had breakfast by Donnely Dome and then made our way back to Fairbanks.

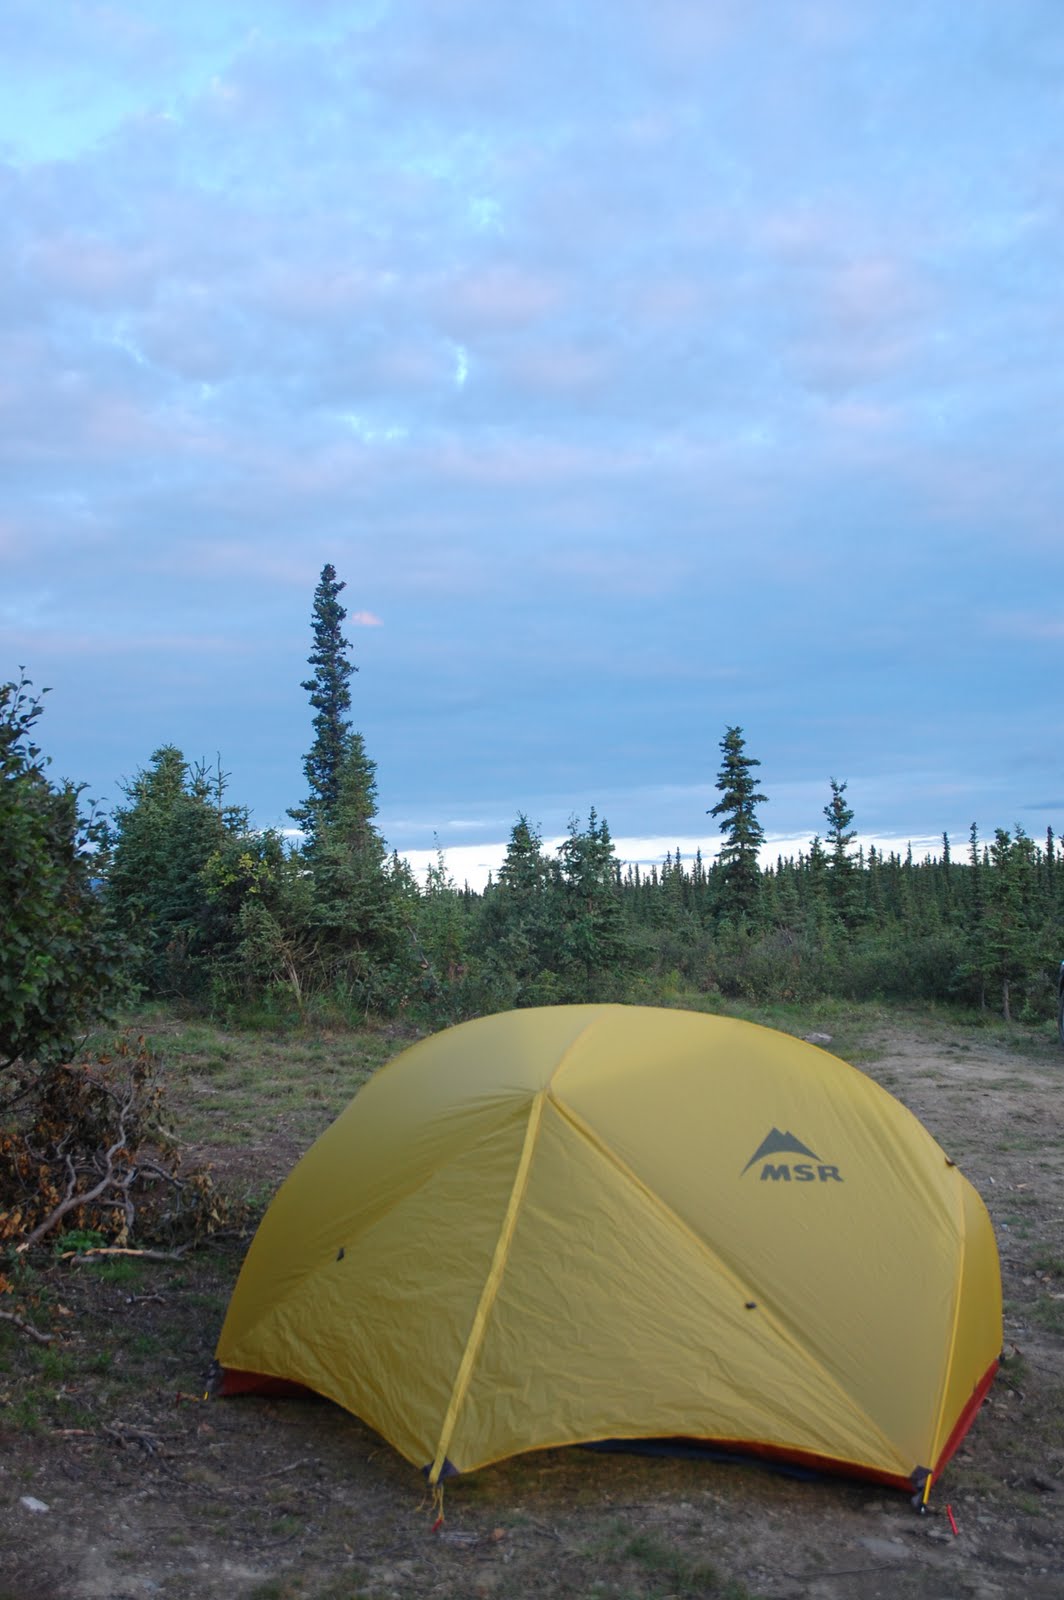
Coal Lakes camping site


A lovely AK sunset


Wednesday, July 28, 2010

Presentation day

Today I gave a presentation to the department and Rod March of the USGS and several other USGS employees that were teleconferenced. The presentation was an update on what I have been working on and was meant to spur discussion on what I could be doing better or other aspects of the project that I could explore. I think it went pretty well. Discussion points included

-sensitivity analysis on the parameters of the model vs hand waving calibration
-how the outline of the glacier changes and affects the discharge/mass balance in the model
-how unreliable the discharge data is. Not to expect perfect matches
-in 2004 ash from nearby forest fires covered the glacier and changed melt patterns

Rod March was extremely helpful! Thank you Rod!

I've included jpeg version of the presentation below. The presentation should be a good summary of what I have been doing for the past month. The model is pretty much calibrated at this point. Now I am ready to get the future climate data from Jing Zhang and run the model using the future data and then analyze it and see what looks interesting!


Friday, July 9, 2010

Grid files in MATLAB

Regine gave me a matlab program to read .bin files so I am completely disconnected from IDL now and have more flexibility. Here is what the grids look like once they are read by MATLAB. This is more flashy than it is that helpful, but it's nice to visualize the glacier.Gulkana DEM. Elevation of Gulkana area


Gulkana glacier elevation. This is the elevation of just the glacier.


Visualizing slope of the area. Dark blue is flat (0°) and and red is vertical (90°).


Visualizing aspect.


Day 12 - Adding Mass Balance


All 40 years of simulated and measured data yay!


Today after simulating all 40 years of data using model 1 (woohoo!) I worked on getting mass balance output. The USGS measured mass balance data is pretty messy and hard to work with, but it will do for now just starting. After plotting the mass balance data (measured vs simulated) it looks really bad so there is something wrong either with the data or the model. Hopefully I will figure that out.

There are three mass balance components that the model works with; winter, summer, and net. Winter mass balance measured the change in mass balance during the winter, summer mass balance measures the change during the summer, and the net is the winter minus the summer or the total mass balance for the year. Snow accumlates during the winter so mass balance is positive and melts in the summer so mass balance is negative and the net measures whether more snow accumlated or melted during the year.

Mass balance combined with disharge gives a pretty good idea about how the glacier is melting and fitting the model to both mass balance and discharge ensures that the model is appropriately and accurately modeling the glacier dynamics.


PLAN:
refine mass balance
more matlab!
calibrate model 1 and 2

Thursday, July 8, 2010

Day 11 - Output!

Since the last major accomplishment of making the most basic model run and produce some output, there were some roadblocks and bugs in the model that have taken the last few days to iron out. I can also now run the model completely on my computer independent of Regine's computer which is nice.

The melt of the glacier is accounted for in the discharg so we had to get that component working for the model. The model reads measured discharge data and also produces simulated discharge data and then compares them with an r^2 value (measures how well the measured and simulated data matches up and therefore how well the model is working). I'm now at the point where I can begin to calibrate various aspects of the model and try to get my r^2 value as close to 1 as possible and make the discharge curves match. I have to run the model for all 40 years and see what happens (hopefully that works!) and I have to run the model number 2. Model number 2 takes into account solar radiation and topographic shading of the area. Right now I am running the simplest model that only looks at temperature/melt relationship and gives a degree day factor based on this relationship for ice and for snow.


This is an example of the discharge plots that I can now create in MATLAB.


Calibrating the model is interesting because different combinations of the different parameters will yeild the same result. It is important that I match discharge data as well as mass balance data that is simulated and measured. The more outputs I have to match, the number of different combinations of variables decreases and I will be more likely to find some realistic values for those variables.

Regine and Anthony seemed very happy with how well the model seemed to work already with just random and arbitrary values for the variables and the expect that the USGS will be very interested in what I found out. They also expressed interest in creating a little paper out of this project which could then be published! Cool!

I'm also still working in MATLAB and plotting the output from the model in MATLAB. It's been very convienent to learn how to use the model and MATLAB simultaneously. I'm now working on writing scripts that are general enough for anyone to be able to give the name of the data file and then produce a graph with a MATLAB script.

NEXT:
Keep working on MATLAB
Calibrate the model 1 or 2?
Start looking at Mass Balance Data

Wednesday, June 30, 2010

Day 7 - The day the model ran!

The model:

After many valiant efforts, the model finally ran. To do this I had to update input.dat with all my case specific information eg. where my files where, what my data was like, what I wanted my output to be etc. This sounds a lot more simple than it actually is, because every line in input.dat has to be perfect and readable by the model.

Then we compiled the model in C and ran it. Regine updated the model and the handbook which I now I have my hands on (the bible!).

The output is just a txt file of discharge for whatever days and time steps you asked for and then this can be plotted graphically. There are multiple options for output, but this is the most simple. I need to get the actual discharge data and compare and that is where calibration of the model comes in because I can change things in the model to make it represent the actuale data.

Originally, the model would not run on the windows laptop of hers that I was using, but then we tried it on her mac and it worked. We think that the windows laptop does not have enough memory to run the model. The goal for the future is to have the model run on my laptop. I need gcc on my computer to do this as well as all the updated files and directory.

MATLAB:

I also worked on plotting things in Matlab and playing around with that. It was fun. I produced this figure. I need to learn how to be able to plot multiple years.


Today is my birthday!

Monday, June 28, 2010

Day 6

10am-6pm

-downloaded the student version of MATLAB.


We decided that it would be best to work from my computer and have all the matlab and files I needed on my laptop so I could have it with me for future reference. It cost me about 100 smakeroos, but I guess that is what I'm getting paid for. I need to get a C compiler on my computer and then I should be all set. All the IDL stuff is on her laptop still though. Not really sure how I will be able to transfer between the two.

-Prepped input files to run the model for Gulkana in IDL.

This was a lot more complicated than it sounds. In order to calculate melt, the model needs the solar geometry of the topographic area to calculate the direct radiation. Using IDL we created grids for aspect and slope and DEM (elevation). Once all of this was working we looked at the DEM for the Gulkana drainage basin. The data from the USGS was incomplete and missing a section. This was not good. With the help of Anna in hydrology, we were able to use the drainage basin she had created and multiply it by the DEM for the total area and fill in the missing values. Once we had a complete and accurate drainage basin, we ran the direct radiation program in C++. The output for this comes in the form of a binary file for the average direct radiation for every day for a year. This does not change from year to year and we can look at each file as a grid in IDL. The model then uses this information to help calculate melt.

We also talked about the difference between firn and ice. At the end of the summer when the most melt has occured, firn is the snow that stays on the glacier where as ice is the ice. The firn has a much higher albedo and reflects a lot more light than ice because ice is darker, therefore the two have different melt factors. This is acknowledged in Regine's model and is another input file that the model uses to calculate total melt.

After using IDL and C more today I feel a little more comfortable navigating in these programs and I feel like I'm getting a better sense of the model and the multiple components that it contains. Regine explained to me that we have the simple temperature-index model which is simply a degree day factor (DDF), two different ones for ice and snow, multiplied by a temperature. Then her more refined model breaks down the DDF into a melt factor and radiation based on topography because different slopes and aspects will have different melt.

After today we now have all the input files needed to run her more refined model and to create an output simulated discharge. Hopefully this is what we will accomplish tomorrow. This is just so I can get a general sense of how to run the model and all the dials and nobs that need to be refined and tuned. The meat of the project then is comparing the simulated discharge to the discharge data from the USGS (which we still need to obtain) and then calibrate the model to fit the two data sets as close together as possible. All the while, also working on putting everything into MATLAB.

-I got on board doing some field work in Yakutat for a few weeks at the end of August with Barbara. I'm really excited about this and looking forward to it!

Thursday, June 24, 2010

Day 5

9am-5pm

The goal:

Convert all of Regine's DEM grid data and climate plots from IDL to MATLAB.

The plan:
Start by writing a MATLAB program that plots temp and precip and discharge data as a line graph (x-axis: time, y-axis: temp, precip, discharge) from Gulkana glacier. The program must ask for the input data file, in ascii form (or binary?), and then plot the graph and possibly provide the user with max, min, and mean of each element. Hopefully, I will be able to refine the program so that it is user friendly and easy to work with in MATLAB. The end result would be three graphs with the same timescale so that they could be easily compared and easy to work with and show simulated and real data for each element.

Next, is being able to visually represent the elevation, aspect, and slope of the topography from DEM data of Gulkana like her IDL program does. Regine gave me a simple input DEM data to grid program to work off of. The goal for this would be to refine it again to be as user friendly as possible and to display two maps of different times and be able to find the difference. The input files must be in binary form, however, I could easily write a program that transfers files from bin to ascii and ascii to bin, though she already has a C program for this.

Questions:
Still not really sure how C fits into all of this?
How is the simulated data actually created? Have only glipsed at the real model.
Need to get MATLAB and a C++ compiler on my computer (ask Dad)
Need discharge data from Gulkana
Need aspect, slope, and elevation data from Gulkana still?

Worked on today:
Put all the excel temp/precip data in the right form and exported it as an ascii file.

Next step:
Import that data into MATLAB and creating a plot. Then create a program that does all of this for me.

Wednesday, June 23, 2010

Day 4

9am-5pm

MATLAB day

Learned how to use MATLAB and write basic programs. My major accomplishment was writing a program from scratch that solved for the roots of quadratic equations and going through a tutorial on writing a program for projectile motion. cool.

Tuesday, June 22, 2010

Day 3

9am-5pm

Overview of model

Yikes! Crash course of the model with Joanna and Regine in the morning. Joanna will also be using the model this summer and hopefully we can work together when we get stuck!

Monday, June 21, 2010

Day 2

9am-5pm

I met everyone in the department and talked with Regine and Anthony about the project and we created a plan. I got the USGS files for temp and precip of Gulkana and begin putting them in a better format.

Thursday, June 17, 2010

Day 1


8am-5pm

-Permafrost Tunnels with the International Summer School in Glaciology program.


This program was put on by the glaciology dept. for graduate students. They were in McCarthy for 10 days. I really hope I can do this one day. We went to the permafrost tunnels run by the Army Core of Engineers. It was really neat. There are giant ice wedges and frozen bacteria and mammoth bones.

http://www.gi.alaska.edu/snowice/glaciers/events/summer_school/


http://www.alaska.edu/uaf/cem/ine/permafrost_tunnel/permafrost-tunnel.xml


-Attended an afternoon lecture series about snow, ice, and permafrost

It was really informative. Lots of stuff I didnt understand but it was a good introduction and I enjoyed hearing about all the projects going on at UAF centered about arctic research.